Green Budget 2022 - Chapter 5

Downloads
Reforms, roll-outs and freezes in the tax and benefit system
PDF | 720.17 KB
Key findings
1. Many tax and benefit thresholds, allowances and amounts (‘parameters’) are by default uprated every year in line with prices or in some cases earnings. But others are frozen in cash terms, sometimes temporarily by explicit policy choices but often indefinitely. Compared with uprating, such freezes reduce household incomes and strengthen the public finances – all the more so in the high-inflation environment we currently find ourselves in. These freezes – which represent a stealthy and arbitrary way to raise tax revenue – often have a bigger impact on household incomes than more eye-catching discretionary measures. Several benefit reforms are also being rolled out over the coming years, which also overall act to reduce household incomes.
2. The range of frozen parameters is wide, covering many aspects of the tax and benefit system. For example, we are one year into a four-year freeze in the income tax personal allowance and higher-rate threshold, which is set to raise the government £30 billion per year when finished. But other parameters are frozen indefinitely – including the £100,000 threshold where the personal allowance begins to be withdrawn, the benefit cap, the maximum assets that universal credit claimants can have, and local housing allowance rates which cap recipients’ housing benefit.
3. Freezes to personal tax parameters alone will reduce households’ income by £1,250 on average by 2025–26. Adding in freezes to benefits and gradual policy roll-outs brings that figure to £1,450, or 3.3% of income, and means a £41 billion boost to the exchequer. That is double the £20 billion gain in household income (and loss to the exchequer) from the high-profile personal tax giveaways – the reduction in National Insurance contributions and 1p cut to the basic rate of income tax. In other words, on average for every £1 households gain from high-profile cuts to rates of income tax and National Insurance, they lose £2 from the freezes and policy roll-outs. Not only does this hold in total, but in every income decile the average impact of gradual roll-outs and freezes outweighs the impact of the explicit discretionary policy changes.
4. The combined impact of headline tax changes, policy roll-outs and frozen taxes and benefits by 2025–26 is broadly regressive, with the poorest seeing income falls of 2.8% of income and the richest falls of only 1.1%. Headline cuts to income tax and National Insurance will benefit higher-income households who are more likely to get more of their income from employment, while the poorest tenth of households will gain only £13 per year from these measures. Because some tax thresholds and – especially – benefits values are indefinitely frozen, the impact of freezes only grows over time. As a result, by 2030–31 the total changes to the tax and benefit system are more clearly regressive, with the highest-income tenth seeing a 1.3% fall in income and the lowest-income tenth a 4.7% fall.
5. Freezes to tax thresholds and benefit values combined with higher-than-expected inflation change the shape of the tax and benefit system. The four-year freeze to the personal allowance and higher-rate threshold (scheduled to run to March 2026) is expected to increase the share of adults paying income tax to 66% (35 million) and the share paying the higher rate to 14% (7.7 million), compared with 63% (34 million) and 11% (6.1 million) today. The point at which the personal allowance begins to be tapered away (£100,000) and the additional-rate threshold (£150,000) have both been frozen since their introduction in 2010. By 2025–26, 3% of adults (1.6 million) will have some of their personal allowance withdrawn, and 1.4% (760,000) will pay additional-rate tax – in both cases around triple the equivalent number in 2010 when the thresholds were created.
6. The freezing of the £50,000 threshold at which child benefit begins to be withdrawn has led to 26% of families with children (2 million) now losing some or all of their child benefit – double the proportion when the policy was introduced a decade ago. In addition, the frozen benefit cap means the number of families with capped benefits could hit around quarter of a million in 2025–26 – double the current figure, and three-and-a-half times as many as when the cap was last actively reformed in 2016.
7. Freezes mean the shape and size of the tax and benefit system change in an uncertain and arbitrary manner, depending on unpredictable changes in inflation. Millions more are set to be paying higher tax rates by 2025–26 than the government could have predicted when income tax thresholds were frozen in April 2021, purely because prices have increased at an unexpectedly high rate. These problems are worse in a high-inflation environment, but even in times of lower inflation, freezes reduce the transparency of tax and benefit reforms, allowing the size of the system to be changed by stealth. All tax and benefit parameters should be uprated by a sensible index. If the government wants to raise taxes or cut benefits, it should tell us what real value it thinks the parameter in question should be, and not let it be unpredictably buffeted around by inflation.
5.1 Introduction
High-profile reforms to the tax and benefit system have long been a core part of the economic policy landscape, and that is no different today. The new Prime Minister and Chancellor have announced reforms to scrap the health and social care levy and reverse the associated recent National Insurance contributions (NICs) rise; scrap the planned rise in the rate of corporation tax for April 2023; and cut the basic rate of income tax by 1p in 2023–24 (rather than in 2024–25 as originally announced by then-Chancellor Rishi Sunak in March 2022). These are big, deliberate and high-profile fiscal decisions which will increase disposable household income. The Energy Price Guarantee and other energy support measures also represent significant income boosts for household incomes, though this chapter focuses on policies with a permanent effect on the tax–benefit system rather than this one-off support package.
But as well as explicit policy changes such as these, the tax and benefit system is gradually and stealthily changed over time, as various thresholds, allowances and benefit amounts (herein ‘parameters’) are frozen either for a defined period or permanently, resulting in falls in their real value as prices rise. This matters all the more in the high-inflation environment – and the more uncertain inflation environment – we now find ourselves in. In addition, other reforms (especially benefit changes) are often slowly rolled out, meaning that their impact grows over time.
This chapter will show the impact of freezes and gradual roll-outs on personal taxes and benefits, as well as considering some large discretionary changes to the tax system that are planned in the coming years. We show that the combined impact of freezing various parameters is highly significant, and larger than the effect of explicitly announced reductions in the rates of income tax and NICs.
By default, many tax and benefit parameters rise by growth in some index: the Retail Prices Index (RPI; mainly duties), average earnings (mainly state pensions) or, most commonly, the Consumer Prices Index (CPI). Indexing parameters this way is entirely sensible: it ensures that, without deliberate policy intervention, the levels of these parameters keep up with some meaningful real values, so that, for example, the level of support the out-of-work benefit system provides delivers roughly the same purchasing power over time, and the incomes of pensioners reliant on the state pension keep pace with the income of the average earner. However, for various historical reasons, and sometimes for reasons of deliberate policy reform, not all parameters are indexed in this way. In Section 5.2, we give a list of frozen parameters, and illustrate the impact of some of these freezes on the shape of the tax–benefit system.
As well as these freezes, there are a number of benefits policies being steadily rolled out, affecting the shape of the tax–benefit system:
• Replacement of the ‘legacy’ working-age benefit system with universal credit (UC). This occurs for three reasons: new benefit claimants can generally only make claims for UC; changes in circumstances can cause claimants to transition from the legacy benefits to UC; and the recently rebooted ‘Move to UC’ scheme transitions existing legacy claimants across to UC even if they have not had a change in circumstances. On current plans, the UC roll-out will be finished by the end of 2024,1 at which point it will be received by 7 million families (Waters and Wernham, 2021), and in the long run will cost the government roughly £5 billion per year more than the system it replaces,2 though with a large number of winners and losers (see Brewer et al. (2019)). As of May 2022, roughly 60% of the roll-out had occurred.3 One additional complication is that those who are transferred to UC under the ‘Move to UC’ scheme will be eligible for ‘transitional protection’. This means that, if they would receive less under UC than they had been receiving under the legacy system, they will continue to receive the (cash) amount they got previously until they have a change in circumstances or their UC entitlement becomes higher. DWP estimates that 600,000 families will receive transitional protection when they are transitioned (Department for Work and Pensions, 2022b) As these transitional protections expire, UC therefore becomes slightly less generous.
• The ‘two-child limit’ in tax credits and universal credit. Prior to this policy, a child born to a family in receipt of tax credits or UC would generate an additional ‘child element’ in the benefit in question, currently worth £2,935 per year. The so-called ‘two-child limit’ means that, in the vast majority of cases, a third or subsequent child born on or after 6 April 2017 will not generate this element. Because of the link to the date of birth, this policy is in effect being slowly rolled out, and this process will not finish until the mid 2030s when all dependent children will have been born on or after 6 April 2017. When fully rolled out, the reform will affect 750,000 households who will lose around £3,600 per year each, saving the government roughly £2½ billion (Joyce and Waters, 2019). As of April 2022, about half of the roll-out had been completed (Department for Work and Pensions & HM Revenue and Customs, 2022).
• Abolition of the family premium in tax credits and universal credit. Prior to this policy, recipients of tax credits and universal credit received a £545 annual premium for having any children (in addition to the child elements discussed above). This is now only available to families where the eldest child was born before 6 April 2017. As with the ‘two-child limit’, this means that the policy will not be fully rolled out until the mid 2030s. When it is, 3.2 million households will be without that £545 premium, saving the government £1.8 billion per year (Joyce and Waters, 2019).
• Abolition of work-related activity premium in employment and support allowance and the equivalent in universal credit. Both universal credit and employment and support allowance (an incapacity benefit for those whose disabilities affect how much they can work) assess the degree of incapacity of claimants. Prior to this policy, claimants who were deemed to have a ‘limited capability for work’, but who may be able to engage in ‘work-related activity’ such as CV preparation, were awarded £1,500 per year for being in that group, on top of their other entitlements. This premium has been abolished for those who began a new claim from 3 April 2017. When fully rolled out, this reform will affect around 500,000 people at any point in time (Department for Work and Pensions, 2015), saving the government £0.75 billion a year. We estimate that in November 2021, 160,000 claimants were still in receipt of the premium.
• Ending entitlement to pension-age benefits for ‘mixed-age couples’. Low-income couples where one partner is above state pension age and the other below – what DWP calls ‘mixed-age couples’ – have historically been able to claim pension credit (and, for renters, housing benefit). Mixed-age couples who begin a benefit claim from 15 May 2019, however, will only be able to claim the rather less generous universal credit. When fully rolled out (i.e. when all benefit claims by mixed-age couples began from 15 May 2019), around 115,000 families will lose out from this policy, to the tune of £5,900 per year each, saving the government £0.7 billion (Cribb and Waters, 2019). An estimated 50,000 families are currently affected by the policy (Department for Work and Pensions, 2019).
Lastly, there are two explicit big personal tax reforms planned for the next six months: the scrapping of the health and social care levy and reversal of the associated NICs rise, and a 1p cut to the basic rate of income tax.
This chapter will first focus on a few specific freezes: those to income tax thresholds, child benefit taper thresholds and the benefit cap. We will show how these freezes have already affected, and are due to affect, the real value of these parameters, as well as how they change the number of (higher-rate) taxpayers and the number of benefit-capped benefit recipients (Section 5.2). We will then move on to study the distributional impacts of freezes to taxes and benefits, policy roll-outs, and planned tax policy changes (Section 5.3). In Section 5.4, we will then consider why freezing parameters in this way is a problem, and make some recommendations for how policy should be changed.
Our basic methodology is as follows. We take household survey data (2019–20 Family Resources Survey, FRS) and uprate them to 2022–23 terms using Bank of England forecasts from August 2022 for key variables (in particular earnings). We then use TAXBEN, the IFS tax–benefit microsimulation model (Waters, 2017), to simulate incomes under alternative future tax and benefit systems. In the baseline system, policy evolves according to current plans, including freezing parameters, rolling out policies, and implementing the two discretionary policy reforms described above. We compare this with a system where all tax–benefit parameters are uprated from their 2022–23 level by the CPI (or earnings, where that is the existing default; in both cases, again we use the Bank of England’s August forecast4
), all policy roll-outs are halted at the point they are at in 2022–23, and no planned discretionary policies are implemented. In Box 5.1 later, we discuss in more detail how we model policy roll-outs.
5.2 Long-term freezes change the shape of the tax–benefit system
In this section, we show some of the huge range of tax and benefit parameters that are subject to In this section, we show some of the huge range of tax and benefit parameters that are subject to freezes. We then examine some specific frozen parameters and show how they steadily change the shape of the tax and benefit system, before showing how the freezes affect the value of the parameters, and the implications for the number of taxpayers and benefit recipients.
Summary of frozen parameters
Tables 5.1 and 5.2 provide a non-exhaustive list of frozen parameters in the tax and benefit systems respectively, when they were frozen, and what level they would be today if they had been CPI uprated since then. The impacts of most of these freezes on household incomes are modelled in Section 5.3. This chapter will take a closer look at three of these freezes (income tax thresholds, child benefit taper thresholds and the benefit cap), giving detail on the size of the impacts and the implications of these.
Table 5.1. Frozen tax parameters
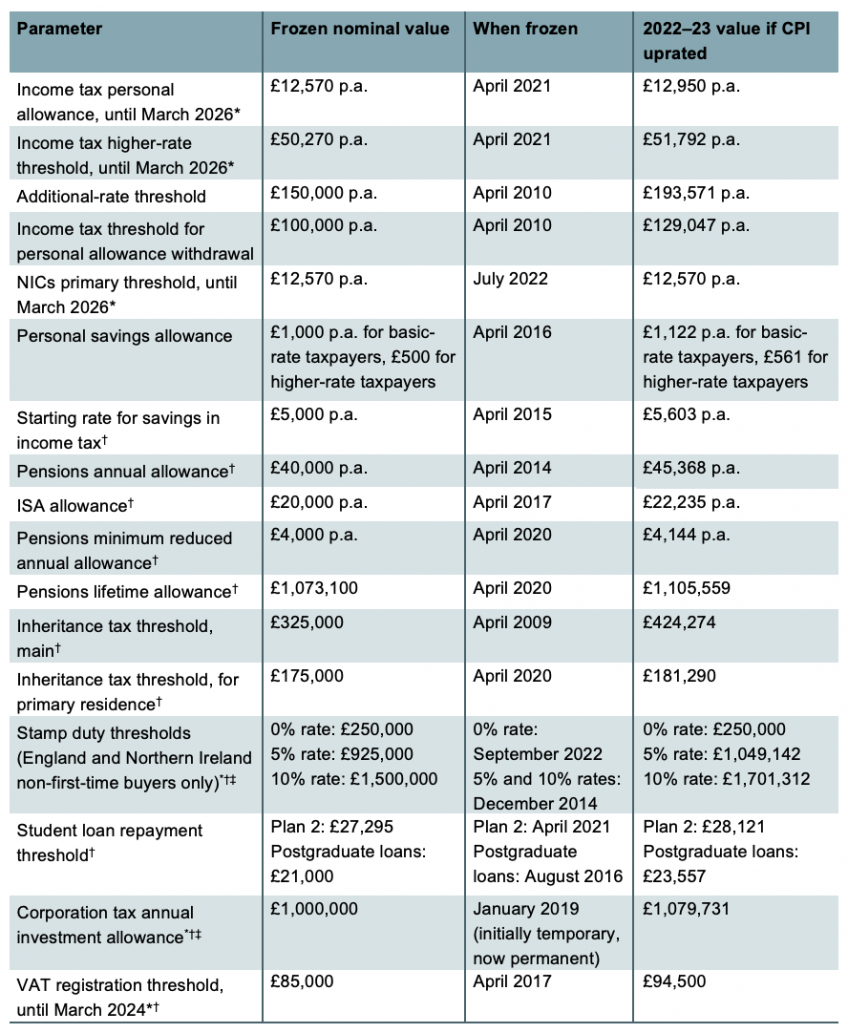
Note: Freezes not modelled in this chapter are marked with a †. Parameters frozen due to recent policy decisions are marked with a *; other parameters are frozen by default. Parameters marked with a ‡ were temporarily increased from July 2020 to September 2021. p.a. = per annum.
Table 5.2. Frozen benefit parameters
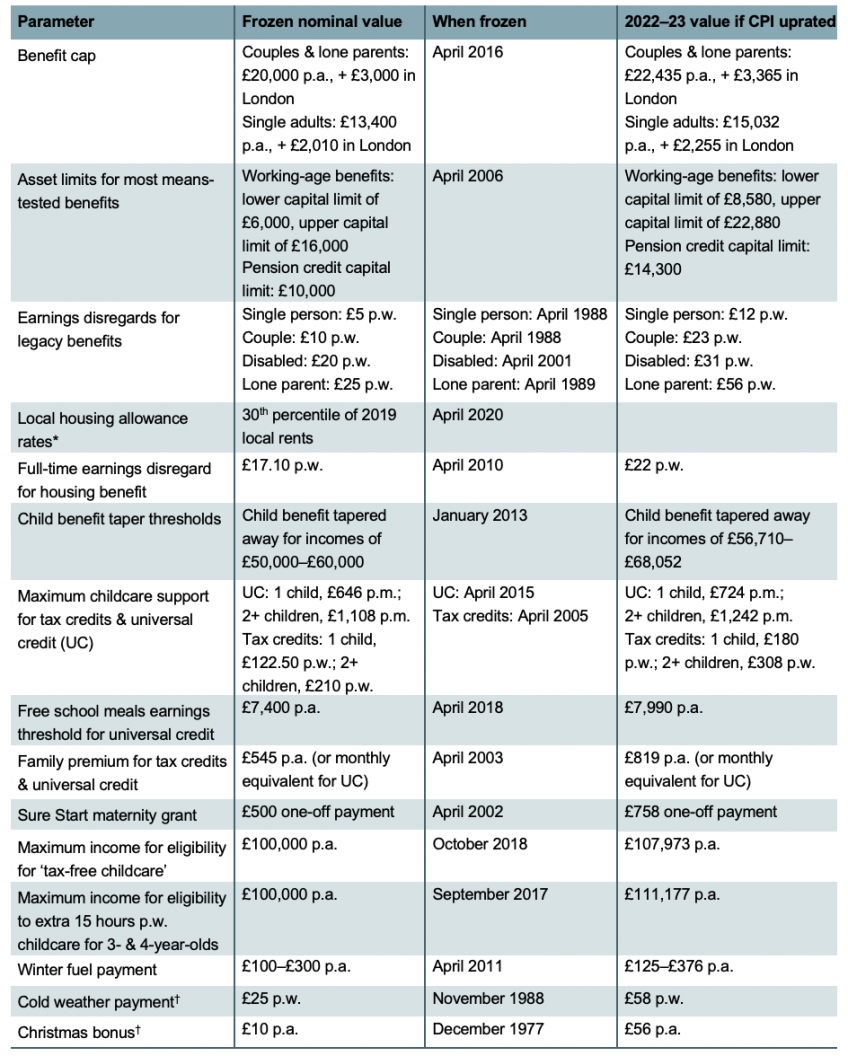
Note: Freezes not modelled in this chapter are marked with a †. Parameters frozen due to recent policy decisions are marked with a *; other parameters are frozen by default. p.a. = per annum; p.w. = per week; p.m. = per month.
The list of frozen parameters is long and wide ranging, affecting almost all areas of the tax and benefit system. They affect whether people are liable for taxes or eligible for benefits, and the amounts they pay and receive. For example, the freeze in asset test thresholds since 2006 means families could hold £6,880 more in assets in real terms then than they can today, before becoming ineligible for benefits. The frozen child benefit taper thresholds mean families’ highest earners now become ineligible for child benefit with a level of earnings £8,052 lower in real terms than when the policy was introduced in 2013. If the Sure Start maternity grant had been uprated, new low-income mothers would receive £758, over 50% more than the frozen amount. On the tax side, the freeze of inheritance tax thresholds means that (for non-homeowners) nearly £100,000 less than in 2009 can be bequeathed in real terms before estates become liable for inheritance tax. The pensions annual allowance freeze means £5,368 less can be saved in a pension tax-free than in 2014, while £2,235 less can be saved each year in an ISA than in 2017. And as Section 5.3 will show, freezes to income tax and National Insurance thresholds will by 2025 more than offset the headline planned tax cuts.
Different freezes affect very different parts of the income distribution and different family types, but, compared with maintaining the real values of parameters, almost all reduce household incomes and strengthen the public finances (by either reducing benefits or increasing tax revenue); and currently high inflation has made all of them more important. Put simply, the decision of whether or not to freeze a threshold in cash terms matters a lot more when inflation is running at around 10% (as it is currently) than when it is hovering around the Bank of England’s 2% target. And higher inflation is typically associated with more uncertain inflation. By 2025, consumer prices are expected to have risen 24% on the current year (2022–23) – but frozen parameters will (on current policy) remain unchanged. Moreover, freezes can have knock-on effects for work incentives – both strengthening and weakening them – and sometimes can exacerbate bizarre aspects of the system (as Adam and Johnson (2019) show for the pensions allowances, and as we show later in this section for child benefit). Importantly, most of these parameters are indefinitely frozen, meaning that without explicit policy intervention the impact of the freezes will grow more and more each year.
It seems as if there is an increased tendency to introduce new parameters without an uprating rule. The additional-rate threshold, the point at which the personal allowance is withdrawn, pension contribution allowances, the personal savings allowance, the maximum income for eligibility to ‘tax-free childcare’ and an extra 15 hours per week of childcare, the child benefit taper, the benefit cap and the maximum earnings for free school meals eligibility in UC have all been introduced since 2010 and all are by default frozen. Over the same period, we have also seen some very important time-limited (but long) freezes, including the four-year freeze to income tax and NICs thresholds we are in the midst of, and a four-year freeze to most working-age benefits between 2015–16 and 2019–20. This is lazy policymaking.
Income tax thresholds
In 2022–23, no income tax is paid on the first £12,570 of income (the personal allowance); a 20% rate is applied on the portion up to £50,270 (the higher-rate threshold); a 40% rate on the portion up to £150,000 (the additional-rate threshold); and a 45% rate above that. In addition, £1 of personal allowance is withdrawn for every £2 of income above £100,000 – with the effect that those with incomes between £100,000 and £125,140 face a marginal income tax rate of 60%.
The personal allowance and higher-rate thresholds usually go up annually with CPI, but are currently frozen at their 2021–22 level, where they are due to remain for three more years until March 2026. The additional-rate threshold and personal allowance withdrawal threshold have been frozen since their introduction in 2010–11, and both will, on current policy, be frozen indefinitely. On the August Bank of England forecasts, this means that in 2025–26 the value of the personal allowance, higher-rate threshold, personal allowance withdrawal threshold and additional-rate threshold will be 19% lower than today, and hence, in current prices, £10,168, £40,664, £80,889 and £121,333 respectively. In the decade prior to the freezing of the personal allowance and higher-rate threshold, we saw a number of discretionary changes to both parameters. The personal allowance had been significantly increased, and so even after the four-year freeze will still be higher in real terms than it was in 2010–11 (£10,168 versus £8,356). The higher-rate threshold, however, was subject to a number of nominal cuts in the first half of the 2010s, then above-inflation increases in the second half. The net effect is that by 2025–26 the higher-rate threshold will be considerably lower in real terms than it was in 2010–11 (£40,664 versus £56,619).
The impact of these freezes to income tax thresholds will be to increase steadily the number of income tax payers, as well as the number paying higher rates of income tax – an example of what is known as ‘fiscal drag’. This is illustrated in Figures 5.1 and 5.2, which show the share of adults paying any income tax, and paying higher-rate tax, over time respectively. The diamonds show how those shares are expected to change under current policy (freezing the thresholds) and how they would change if there had been no income tax freeze. By 2025–26, the share of adults paying any income tax is expected to be 66% (35 million), compared with 63% today (34 million), and around the highest level on record. If the personal allowance had gone up in line with inflation, only 59% (32 million) would be projected to pay income tax in 2025–26 – reflecting the fact that earnings are expected to grow more slowly than prices. The share of adults paying higher-rate tax is expected to increase to 14% (7.7 million), compared with 11% today (6.1 million). This is over double the proportion in 2009–10, and almost four times that in 1990. It is also above the 9% (4.6 million) that would be expected if the higher-rate threshold had gone up in line with inflation.
Figure 5.1. Number of income tax payers, as a share of adults
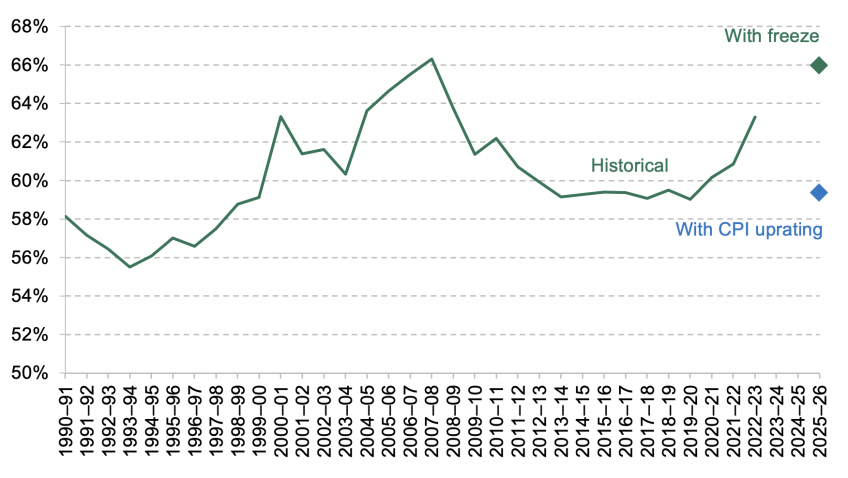
Source: HM Revenue and Customs, 2022. Authors’ calculations using inflation and earnings forecasts from Bank of England (2022), Family Resources Survey 2019–20 and TAXBEN, the IFS tax and benefit microsimulation model.
Figure 5.2. Number of higher-rate taxpayers, as a share of adults
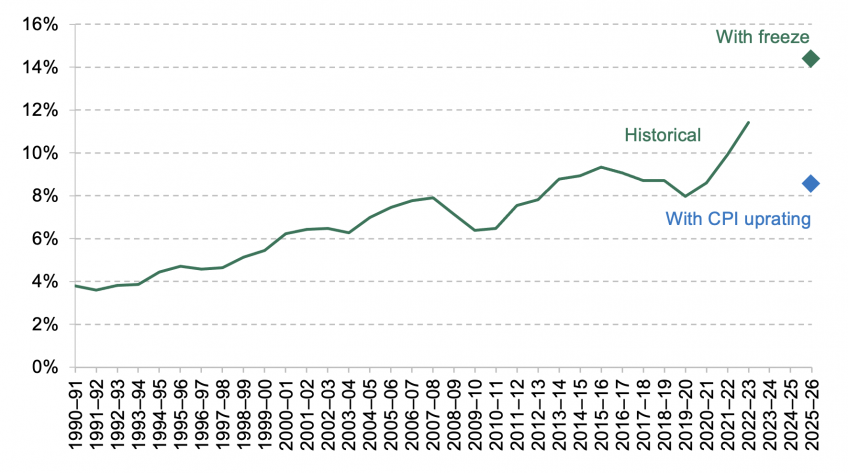
Source: HM Revenue and Customs, 2022. Authors’ calculations using inflation and earnings forecasts from Bank of England (2022), Family Resources Survey 2019–20 and TAXBEN, the IFS tax and benefit microsimulation model.
Freezing these parameters also increases the tax liabilities of those who are already taxpayers. By 2025–26, the four-year freeze to the personal allowance will be costing the typical basic-rate taxpayer £500 per year in today’s prices, while the freezes to both the personal allowance and higher-rate threshold will cost typical higher-rate taxpayers around £3,000 per year.
These numbers all go up when inflation increases, so while the four-year freeze to the personal allowance and higher-rate threshold was expected to raise £8 billion per year when it was announced, it is now expected to raise £30 billion per year.5
Larger numbers of people will be paying higher rates of tax than the government expected when the policy was decided, purely because inflation has increased more than forecast.
The share of adults paying additional-rate tax has more than doubled from 0.5% (240,000) in 2010–11 (when the additional rate was introduced) to 1.2% (630,000) in 2022–23. Had the additional-rate threshold been indexed to CPI, we estimate that only 0.7% of adults (390,000) would be paying additional-rate tax today, meaning that 240,000 have been dragged into additional-rate tax because of the freeze. If it continues to be frozen (as is current policy) then by 2025–26, 1.4% of adults (760,000) will be additional-rate taxpayers.
The freezing of the threshold at which the personal allowance begins to be withdrawn (£100,000) has taken place over the same period. At its introduction in 2010–11, 1.0% of adults (530,000) had at least some of their personal allowance withdrawn because their income was over £100,000. That figure now stands at 2.4% (1.3 million), but we estimate it would have been just 1.3% (710,000) if the threshold had been indexed to CPI. If, as current policy implies, it continues to be frozen, by 2025–26 3.0% of adults (1.6 million) will have at least some of their personal allowance withdrawn.6
That is three times more families being affected than when it was implemented by the last Labour government in April 2010.
It would be sensible to index all tax thresholds to the same series (say, CPI or average earnings). The current practice of freezing some indefinitely and by default increasing others with prices means that, without any deliberate policy intention, the shape of the tax system changes over time. For example, the size of the 40p band of income tax (between the higher- and additional-rate thresholds) has slowly declined over time, as the higher rate usually goes up with prices, and the additional rate has never changed. Moreover, freezing thresholds changes the level of real income one needs to be subject to a certain rate of tax. For example, someone who in 2010–11 had an income of £100,000 was not deemed high-income enough to lose any of their personal allowance. But someone with the same real income today (£129,047 in today’s prices) is deemed sufficiently high-income to lose their entire personal allowance. This change is not because of an explicit choice about redistribution, but just because the point at which the personal allowance is withdrawn has been frozen.
Child benefit taper thresholds
The high-income child benefit tax charge, introduced in January 2013, means that child benefit is tapered away for families whose highest-income partner has an annual income above £50,000. For every £100 of that individual’s income above £50,000, child benefit entitlement falls by 1%. This means that if the higher-income partner’s income is below £60,000, then the family is eligible for a partial payment, whereas if income is at or above this amount, the family is not eligible for child benefit.7
These thresholds are frozen in nominal terms, meaning that every year more families lose eligibility for some or all of their child benefit. At the time the policy was announced, 13% of families with children (1 million) lost some or all of their child benefit (Emmerson, Joyce and Waters, 2019). As a result of the freeze, we calculate the figure is now 26% (2 million families), and this is set to rise to 31% (2.5 million) in 2025–26 if the freeze continues. So by 2025–26, two-and-a-half times as many families will lose some or all of their child benefit as when the policy was first introduced.
Notably, when the policy was initially proposed, the point at which child benefit was due to be tapered was set to be linked to the higher-rate threshold – then £43,875.8
However, when it was actually introduced, the tapering threshold was raised to £50,000 – i.e. more generous than the originally mooted policy. But now the higher-rate threshold is above £50,000, this change has in fact served to reduce eligibility – i.e. there are now some families with children that do not contain a higher-rate taxpayer who are not entitled to full child benefit.
One effect of tapering away child benefit is an oddly shaped marginal tax rate schedule, which jumps up in the range where child benefit is withdrawn, then jumps back down again, illustrated by the solid lines in Figure 5.3. An employee with two children faces a marginal tax rate (including employee NICs) of 32% if they earn just under £50,000. This rises to 60.9% at a little over £50,000 when they begin to pay higher-rate tax and start to lose their child benefit, before falling to 42% when their earnings reach £60,000, by which time they have lost all child benefit entitlement.9
For those with more children, the jump is even more stark, as they have more child benefit to lose.
Figure 5.3. Marginal tax rates by number of children
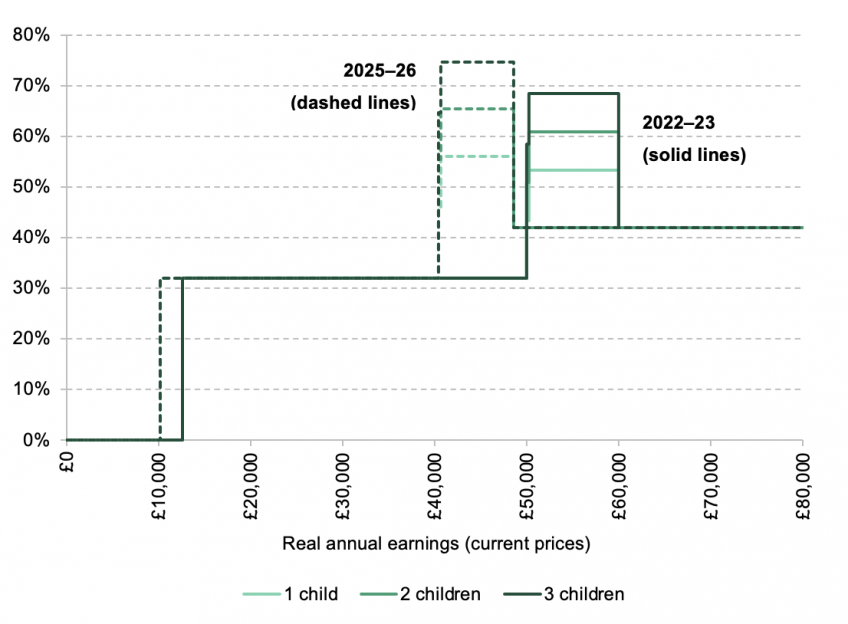
Note: Marginal tax rate for a single earner, or the higher earner in a couple, excluding all benefits other than child benefit. Employer NICs and the 2022 National Insurance rise (to be reversed) are also excluded.
Source: Authors’ calculations.
Moreover, a consequence of freezing the taper thresholds is that the size of the jump in marginal tax rates increases over time, illustrated by the dashed lines in the figure. This is because while the range over which child benefit is withdrawn is frozen, the value of child benefit is not, so the amount of benefit withdrawn with each additional £1 of earnings increases. For example, currently child benefit for two children is £1,885, so an individual with two children on the taper who earns an extra £100 loses £18.85 (1% of the benefit). But in 2025–26 the child benefit rate for the first child is set to rise to £2,330, so earning an extra £100 results in a child benefit loss of £23.30. Because of this effect, by 2025–26 the worker with two children is due to see a marginal tax rate in the hump of the schedule of 65.37%. At the same time, as is also visible in the figure, freezing the thresholds means that the withdrawal of child benefit will affect people in a lower and narrower range of real earnings over time. It is difficult to think of a reason why the marginal tax rate schedule should be hump-shaped in this way, and even harder to imagine why the size of the hump should by default get higher and move down the real income distribution every year.
Benefit cap
The benefit cap limits the total amount of benefits a working-age family can claim, with some exceptions (principally those in work, those who have recently been in work and those with disabilities). It was introduced in 2013, cut in 2016, and has been frozen since. The current amounts are £20,000 per year for couples and lone parents, and £13,400 per year for single adults (higher amounts apply in London, which are also frozen; we focus here on the non-London caps).
At the time of the 2016 cut, the value of the benefit cap was, in today’s prices, £22,435 for couples and lone parents, and £15,032 for single adults. By 2025–26, the values are set to have been eroded to just £16,178 and £10,839 (in today’s prices) by inflation. This amounts to a 28% real cut since 2016.
When the cap was introduced in 2013, only about 25,000 families had their benefit capped. That increased to around 70,000 following the 2016 cut, and as of February 2022 stands at 120,000 (Department for Work and Pensions, 2022a). These families lose out on £3,150 per year on average due to the cap, or 14% of what their income would be if there were no cap, so the impact is significant for affected families. As inflation erodes the value of the cap further, while the basic benefit amounts are largely indexed to inflation, more and more families will be affected by the cap over time, reaching around a quarter of a million by 2025–26.10
This is ten times as many as when the benefit cap was introduced, and three-and-a-half times as many as when it was last actively reformed in 2016.
For families that are capped, the freeze means that the amount lost because of the cap increases in real terms over time. Whatever the merits of the cap in principle, it is difficult to see why it should be frozen – or indeed indexed to anything other than what the basic benefit amounts are indexed to. The current approach means that over time the cap has a bigger and bigger impact, and the amount of real support the benefit system offers to out-of-work families falls – with the size of these effects not determined by any deliberate policy choice, but just by the vagaries of inflation.
5.3 Distributional effects
We now turn to the full set of reforms detailed in Section 5.1. In this section, we model the impact of freezes of taxes and benefits (both those that are indefinitely frozen and those that are frozen for a set period), and the roll-outs of UC and other benefit policies. We simulate the effects in 2025–26 – the final year of the income tax and NICs threshold freezes – and 2030–31. We will then see how these compare against the planned big discretionary reforms to personal taxes – the reversal of the introduction of the health and social care levy, and the 1p reduction in the basic rate of income tax. Table 5A.1 in the appendix summarises the fiscal implications of these reforms.
Freezes and roll-outs to 2025–26
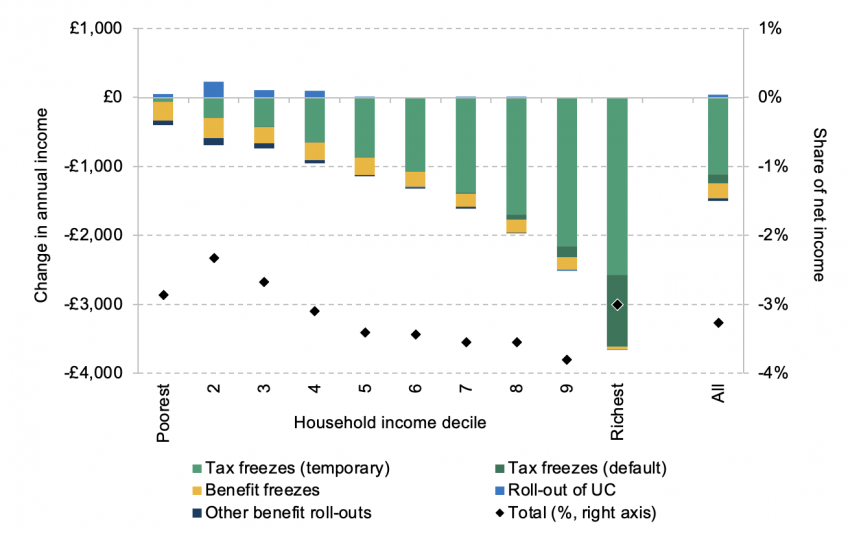
First, Figure 5.4 shows how freezes and policy roll-outs between now and 2025–26 would affect household incomes if no discretionary policy changes were made (i.e. if the two reforms to NICs and income tax listed above were not implemented). The combined impact is to reduce average incomes by 3.3% or £1,450, saving the exchequer £41 billion. The impact is broadly progressive, as poorer households see smaller proportional income falls than richer households.
Figure 5.4. Changes in income by decile: freezes and roll-outs to 2025–26
Source: Authors’ calculations using the FRS 2019–20 and TAXBEN, the IFS tax and benefit microsimulation model.
The main driver of this reduction in incomes, overall and for all but the poorest 20% of households, is freezes to tax thresholds. These will cost the highest-income tenth of households £3,610 per year on average by 2025–26, compared with just £57 for the poorest tenth, who are much less likely to be in work and/or paying income tax. Of the average tax rise of £1,250 per household, the remaining three years of freezes to income tax and National Insurance thresholds account for £1,120. These are labelled ‘temporary’ in the figure because the freeze is time-limited, but of course their impact is permanent, since once the freezes expire the thresholds will only be uprated by annual inflation thereafter, meaning three years of growth will have been permanently lost. The indefinite freezes to other tax parameters fall disproportionately on the richest 10% of households.
Freezes to benefits have a much smaller effect than freezes to taxes, costing the average household £210 per year (and saving the exchequer £6 billion). This means that the indefinite tax and benefit freezes, which occur without any deliberate intervention, will reduce household incomes and strengthen the public finances by £10 billion per year by 2025–26. In a typical year of 2% CPI growth, this figure grows by around a further £1 billion, and will continue to do so beyond 2025−26 for as long as these freezes continue. The freeze in the child benefit taper threshold is particularly felt in the top half of the distribution, accounting for an average drop in income of £64 per year for this group. But the majority of benefit parameter freezes primarily affect lower-income households, with the poorest 10% losing out by £275 per year on average, or 2.3% of their income.
We turn now to gradual policy roll-outs. The assumptions we use about these roll-outs are discussed in Box 5.1.
The overall effect of these roll-outs is small compared with that of freezes, and on average they boost incomes for most of the bottom half of the distribution. This is entirely accounted for by the roll-out of universal credit. Following recent reductions in UC’s taper rate and increases in its work allowances, UC is now on average more generous than the legacy system. Moreover, some of those who are moved to UC receive transitional protection, meaning that if they would receive less under UC than under the legacy system, they continue to receive their legacy entitlement.11
The roll-out of UC more than offsets the various other policy roll-outs detailed in Section 5.1, such as the ‘two-child limit’ and removal of the family premium, increasing incomes for the poorest half of households by an average of £98 per year. The top half of the distribution are barely affected at all by policy roll-outs.
Box 5.1. Policy roll-out modelling assumptions
As discussed in Section 5.1, we model the roll-out of certain policies. This box briefly discusses the methodology we adopt for some of those roll-outs.
• Replacement of the ‘legacy’ benefit system with universal credit. In April 2022, there were 2.6 million claimants still on legacy benefits (Department for Work and Pensions, 2022b). To simulate the tax–benefit system under the scenario where the UC roll-out is halted, we take those who report receiving a legacy benefit in the 2019–20 FRS data, and randomly move some of them to UC in order to leave 2.6 million still on legacy benefits, with the composition (e.g. 1.2 million claimants of employment and support allowance) reported in Department for Work and Pensions (2022b). Current plans are for no families to be left on legacy benefits in 2025–26, but some will still be in receipt of transitional protection, which (in the short run) gives them what they would have received under the legacy system. Based on figures from Department for Work and Pensions (2022b) and Office for Budget Responsibility (2018b), we very roughly estimate that 270,000 will still have transitional protection in 2025–26. To simulate incomes in 2025–26, we approximate transitional protection by randomly awarding 270,000 legacy-benefits-receiving families, who would be worse off under UC, their legacy entitlement. This is an imperfect approximation as precisely when the family moves affects the transitional protection it receives; in particular, those who transition in April 2023 – immediately after benefits rates have significantly increased – will receive much more protection than those who transition in March 2023. When simulating 2030–31 incomes, we assume that transitional protection has expired for all families.
• Abolition of work-related activity premium in employment and support allowance and the equivalent in universal credit. Around 160,000 claimants received the premium in November 2021 (DWP Stat-Xplore). The final policy costing (HM Treasury, 2017, table 2.2) suggests that by 2021–22 the number of claimants with the premium would fall by around 16,000 per year. We assume this rate of change continues to hold going forward, and in accordance randomly remove the premium from those observed receiving it when simulating incomes.
• Ending entitlement to pension-age benefits for ‘mixed-age couples’. Department for Work and Pensions (2019) suggests that the number of mixed-age couples receiving pension-age benefits will fall by 10,000 per year. When simulating future years’ incomes, we randomly move such couples observed claiming these benefits onto UC in accordance with this rate of change.
The distribution of impacts across household types is shown in Figure 5A.1 in the appendix. On average, all household types experience income falls of between 3% and 4%. Families with children are particularly hit by benefits freezes, especially lone parents for whom benefits freezes reduce their income by £760 per year, or 2.8% of their income. Freezes in the child benefit taper rates cause couples with children to lose out on £210 per year, whilst lone parents lose on average £33 from this freeze. Income falls for those without children are more driven by tax freezes.
Discretionary tax changes to 2025–26
In addition to these roll-outs and freezes, two significant discretionary personal tax reforms have been announced. The new Chancellor has announced a plan to reduce the recent NICs rise and scrap the associated health and social care levy, and to cut the basic rate of income tax by 1p in April 2023 (bringing forward by one year a reform announced by the then Chancellor, Rishi Sunak, in March 2022). The proposal to abolish the additional rate of income tax, which would have been a large giveaway to the very richest households, is not included in our analysis given its abandonment on 3 October.
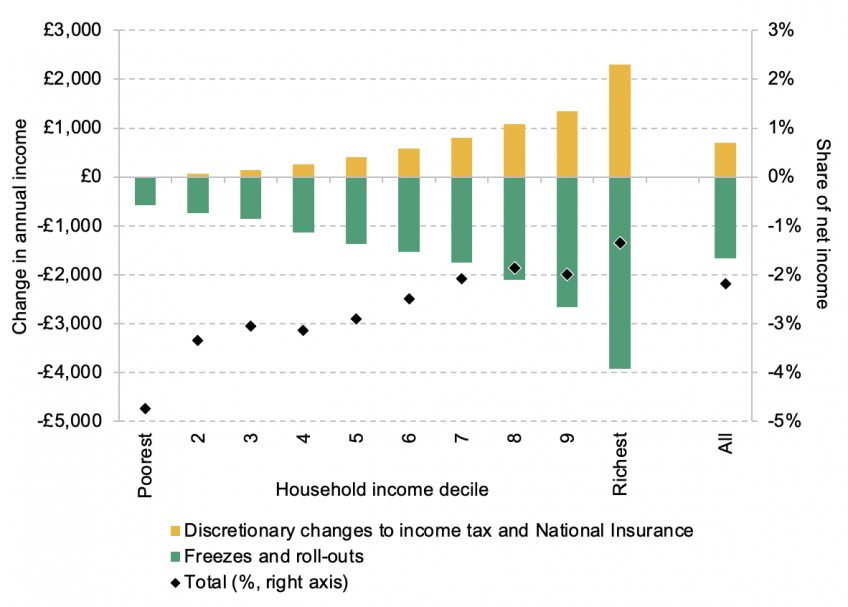
Figure 5.5. Changes in income by decile: freezes, roll-outs and planned discretionary tax changes to 2025–26
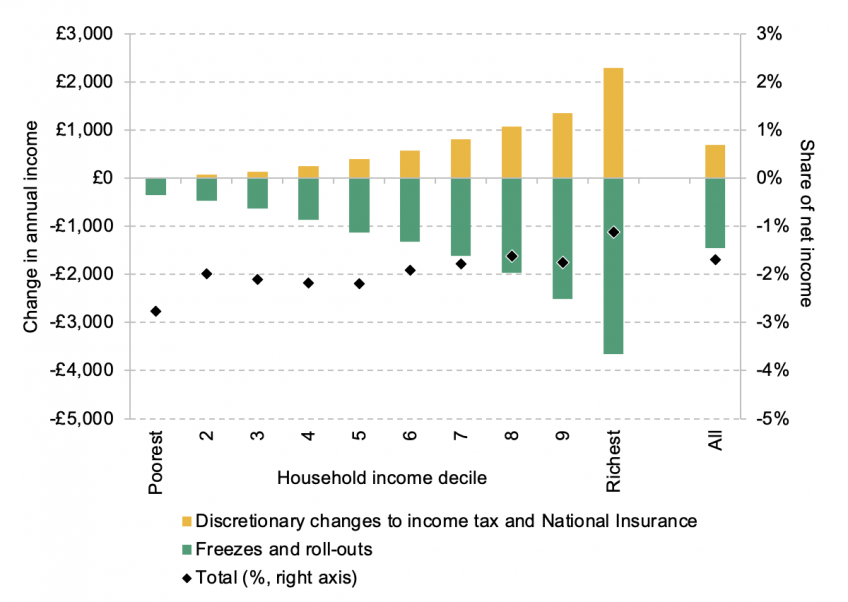
Source: Authors’ calculations using the FRS 2019–20 and TAXBEN, the IFS tax and benefit microsimulation model.
The impact of these changes is shown in Figure 5.5. We show them together as they affect households in roughly similar ways. Together these reforms increase income by £700 per year for an average household. Both changes are regressive, as higher-income households get more of their income from employment. As a consequence, while the richest 10% of households will benefit by £2,290 per year on average, the poorest will benefit by just £13.
Combined with the freezes and policy roll-outs already discussed, the combined impact of all changes to the tax and benefit system by 2025–26 is broadly regressive. On average, the effect is a drop in income of £750 or 1.7%. It is worth noting that neither in the aggregate, nor for any income decile, do the explicit discretionary policy changes outweigh the impact of gradual roll-outs and freezes. In total, the roll-outs and freezes will reduce household incomes (and strengthen the public finances) by £41 billion in aggregate in 2025–26, only half of which is offset by the discretionary tax changes.
Changes to 2030–31
After 2025–26 the income tax and NICs freezes are due to end, but the indefinite freezes will of course continue to shape the tax and benefit system, steadily eroding the value of benefits and increasing taxes. The benefits policy roll-outs will also continue. This subsection illustrates how these effects will grow over time by evaluating the impact of adding an additional five years of freezes and roll-outs (which largely complete over this time), combined with the planned changes to the tax system.
Figure 5.6 repeats the analysis in Figure 5.5, but considers the impact in 2030–31 instead. The combined impact of the freezes, roll-outs and discretionary changes to the tax system is a 2.2% reduction in income for an average household, compared with a 1.7% reduction in 2025–26. The pattern across the distribution is more strongly regressive, with the poorest tenth of households losing 4.7% of their income and the richest tenth losing only 1.3%. The key reason for this is that the indefinite freezes to benefits are more significant than the indefinite freezes to taxes – the benefits takeaway rises from £6 billion to £9 billion from 2025–26 to 2030–31, whereas the tax takeaway rises from £4 billion to £5 billion – and so in total the indefinite freezes tend to affect poorer households more than richer ones. The removal of transitional protection in UC, and the roll-out of the other benefits policies, also reduce incomes for poorer households. In total, the freezes and policy roll-outs reduce incomes and strengthen the public finances by £47 billion by 2030–31, of which £20 billion is offset by the two discretionary tax policies.
Figure 5.6. Changes in income by decile, freezes, roll-outs and planned discretionary tax changes to 2030–31
Source: Authors’ calculations using the FRS 2019–20 and TAXBEN, the IFS tax and benefit microsimulation model.
5.4 Policy recommendations
We now briefly turn to some assessment and policy recommendations based upon the analysis thus far. Our focus here is on freezes and uprating rules.
Freezes and policy design
The large role of freezes in the tax and benefit system is concerning for several reasons. The first is that freezes are hidden and stealthy. They allow the size and shape of the system to change unnoticed, with the government taking more in taxes and giving less in benefits over time, despite the fact that the explicit policy changes planned are giveaways. For example, each year the benefit cap means that the real maximum value of benefits affected families can get declines, and more families are affected – but without any explicit intention to this effect. And the real level of earnings one needs to earn to lose the personal allowance declines – again, not because of a publicised and intended reform to this effect, but because prices rise while the threshold is frozen. This cannot do much good for transparency and the public debate.
The second reason is that the real impacts of freezes are uncertain. By relying on inflation to discreetly raise revenues and reduce expenditure rather than uprating all parameters by a sensible index, the size and shape of the tax and benefit system are subject to the vagaries of inflation, rather than deliberate choices by policymakers. This is illustrated by the rapid rise in inflation over recent months. Freezes are set to have a far larger effect than was expected a year or so ago. Millions are set to start paying taxes, or pay the higher rate, not by design, but because inflation has been so unexpectedly high. Higher inflation also means that the outlook for inflation is now more uncertain.
Third, freezing also tends to lead to policy uncertainty. Frozen parameters generally cannot realistically last forever. For example, the steady growth of nominal earnings means that more and more people will see their personal allowance tapered away, with no inbuilt limit to this process. It is unlikely that any government would accept such a consequence, and so one day the tapering of the personal allowance will have to be reformed. But when this happens is uncertain, as is the magnitude of any reform. Correcting for the unwelcome effects of freezes thus leads to unexpected lurches in policy.
Policy recommendations
In view of this, we offer three recommendations, some of which we have touched on above.
First, the government should by default index all tax–benefit parameters to a well-chosen index. There is no good case for the nominal value of these parameters staying fixed for long periods of time. Moreover, even deliberately chosen time-limited freezes beyond a year or so are generally unwise: as seen in the case of income tax and NICs freezes, swings in inflation mean that the size of the takeaway can change vastly from what was intended. If the government wants to raise taxes or cut benefits, it should decide what real value it thinks the parameter in question should be, and not let it be unpredictably buffeted around by inflation.
Governments have of course turned to freezes for a reason – to raise tax revenue or reduce benefit expenditure. There is an understandable rationale here – freezes allow the maximum improvement in the government’s fiscal position without inducing a nominal cash loss for households, which households may strongly object to. But even for a government that does not want to induce nominal losses, there is a way forward: it can specify the change in a threshold or value relative to inflation (or some other index). For example, the government could state that the personal allowance should increase by CPI minus 2% for each of the next three years. It could add that if CPI is below 2% then the personal allowance will be frozen rather than nominally cut, and the cut will be applied in a later year where CPI is above 2%.12
This approach would allow the government to raise the tax burden (or reduce benefit spending) by as much as desired, with little uncertainty in the real impact of the policy on households, work incentives or the government’s finances, and without inducing any nominal income losses.
Second, precisely which index is chosen people can reasonably disagree upon, but it seems that there are two logical extremes. On the one end, it is hard to think of a reason why a parameter should be uprated by less than inflation. A tax threshold that goes up by less than inflation means that higher tax rates will be applied to steadily poorer and poorer people. A benefit that goes up by less than inflation delivers a declining real purchasing power. On the other end, it is hard to think of a reason why a parameter should go up by more than average earnings13
(or perhaps GDP per capita14
). A tax threshold that goes up by more than average earnings will tend to raise less and less revenue, eventually becoming irrelevant (at least so long as the base that it applies to goes up, in the long run, at approximately the same speed as average earnings). Spending on a benefit that goes up by more than average earnings will take up a steadily growing part of national income, eventually becoming unsustainable. This is in fact the case with the state pension, which grows at the fastest of earnings growth, inflation and 2.5% (the ‘triple lock’). This uprating rule should be ended.
A relevant political economy consideration here is that it is generally easier for governments to (discretionarily) cut taxes and raise benefits than to do the reverse. This potentially creates a danger when combined with a default uprating rule of earnings. To a first approximation, earnings uprating means that tax revenue and benefit expenditure remain constant as a share of national income. If discretionary reforms on average cut taxes and raise benefits relative to default uprating rules, that means there will be a tendency for tax revenue to make up a steadily declining share of national income and benefits a steadily increasing share. Price uprating allows governments to announce giveaways more often than takeaways without putting fiscal sustainability in jeopardy.
More generally, whether a government chooses price uprating, earnings uprating, or something in between, depends upon its political priorities. For example, a government that is concerned about relative poverty, and so wants the living standards of benefit claimants to keep up with those of the rest of society, might uprate benefits by earnings; a government that is primarily concerned about absolute poverty might choose prices. One option the government should stay away from, however, is RPI uprating (the default uprating rules for duties). RPI is not a National Statistic, and CPI is a superior measure of inflation.
Third, there should be an internal coherence to uprating rules. Uprating, for example, the income tax higher-rate threshold by prices but freezing the point at which the personal allowance is withdrawn means that the former gets steadily closer to the latter, changing (without deliberate policymaker intervention) the shape of the marginal tax rate system. The same problem would occur if the higher-rate threshold went up with average earnings but the personal allowance withdrawal threshold went up with prices. Similarly, the benefit cap should be indexed to the same series as basic benefit entitlements. Uprating the latter by more than the former means that the cap bites more and more over time, as (pre-cap) benefit entitlements grow relative to the cap. The government does not have to choose the same uprating rule for all parameters, but within one part of the system (e.g. income tax) the strong presumption should be for the same index to be used across the board.
5.5 Conclusion
Planned discretionary reforms to taxes are returning money to households, with the richest gaining the most. But at the same time, freezes to tax and benefit parameters are significantly and stealthily changing the scope and size of taxes and benefits over time. As prices increase, they drag more people into the tax system and into higher rates of tax, increasing the tax burden, while eroding the value of benefits and reducing the number of people eligible.
The magnitude of these subtle changes should not be understated, as they more than cancel out the impact of the two high-profile explicit policy reforms – the planned cuts to the rates of National Insurance and income tax. For every £1 households on average will gain from these planned tax cuts in 2025–26, they will lose £2 as a result of policy roll-outs and freezes to tax and benefit parameters. Overall, the progressive effect of freezes and policy roll-outs is more than outweighed by the impact of the discretionary tax changes, making the combined impact of changes to the system broadly regressive.
The government should by default index all tax–benefit parameters to a well-chosen index, and it should avoid long freezes, ideally never announcing a freeze that runs for more than one year hence. That there appears to be an increasing trend of introducing new parameters to the system that are by default frozen, and a greater tendency to use time-limited (but quite long) freezes to existing parameters, smacks of lazy policymaking and is concerning. The government should kick this habit. If it wants to raise taxes or cut benefits, it should tell us what real value it thinks the parameter in question should be, and not let it be unpredictably buffeted around by inflation.
Appendix
Figure 5A.1. Changes in income by household type: freezes and roll-outs to 2025–26
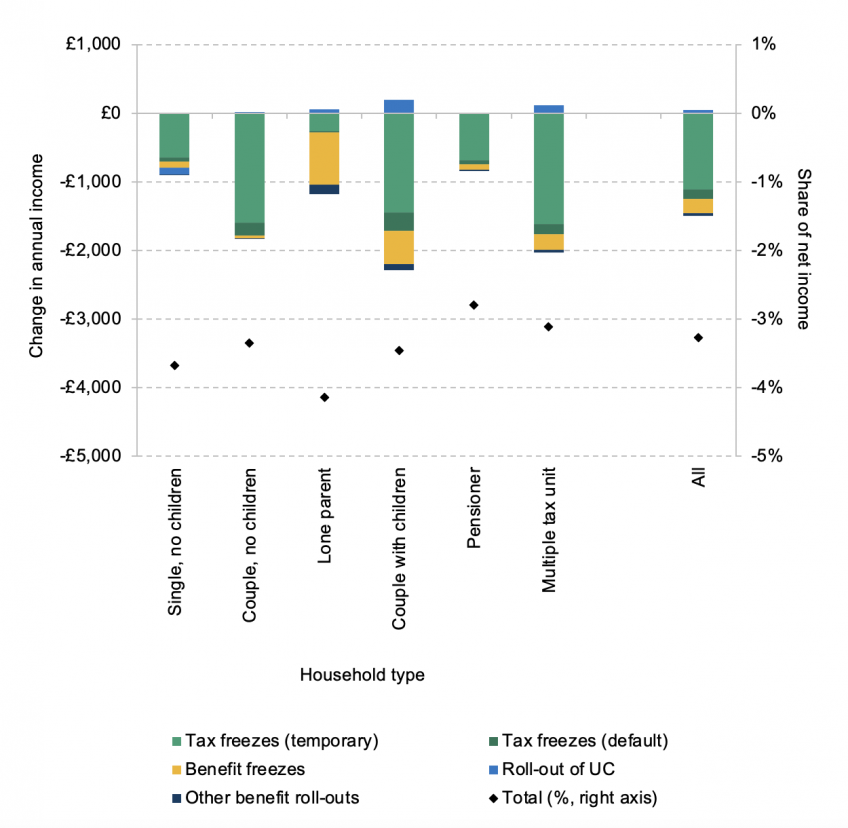
Source: Authors’ calculations using the FRS 2019–20 and TAXBEN, the IFS tax and benefit microsimulation model.
Figure 5A.2. Changes in income by household type, freezes and roll-outs to 2030–31
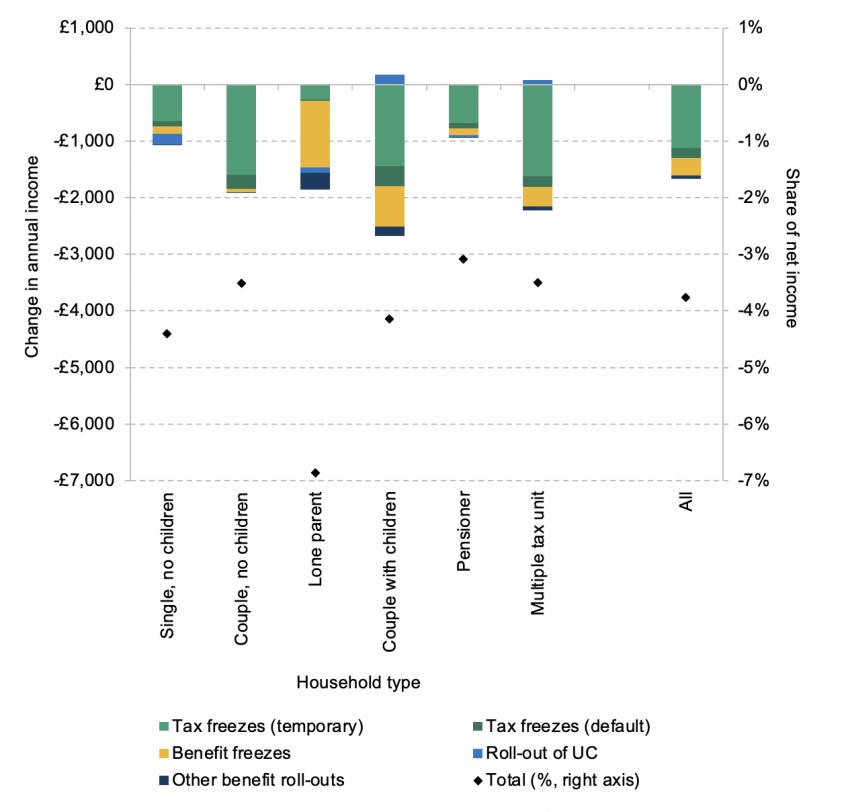
Source: Authors’ calculations using the FRS 2019–20 and TAXBEN, the IFS tax and benefit microsimulation model.
Table 5A.1. Exchequer impact of policy measures
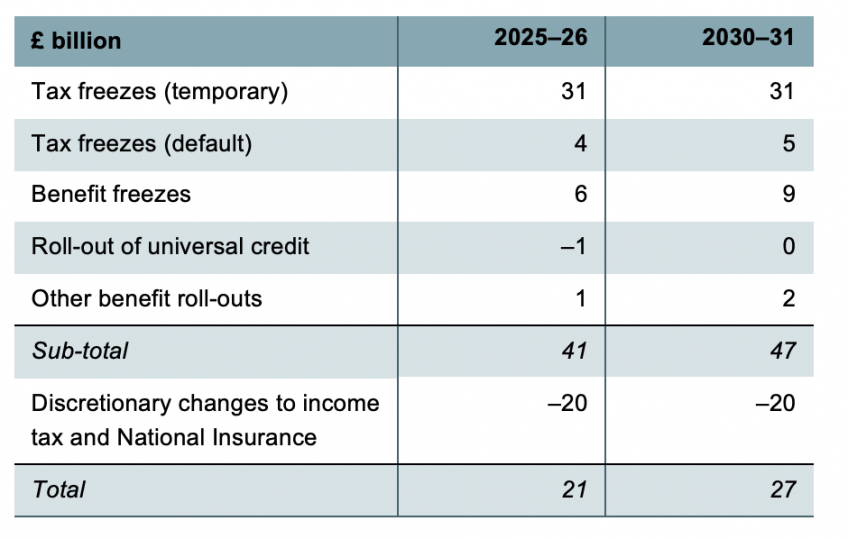
Note: We have not included a reversal of the public sector offset in the calculation of the impact of the reversal of the health and social care levy.
Source: Authors’ calculations using the FRS 2019–20 and TAXBEN, the IFS tax and benefit microsimulation model.
References
Adam, S. and Johnson, P., 2019. Dragging people into higher rates of tax. Institute for Fiscal Studies (IFS), Report, https://ifs.org.uk/publications/dragging-people-higher-rates-tax.
Bank of England, 2022. Monetary Policy Report – August 2022. https://www.bankofengland.co.uk/monetary-policy-report/2022/august-2022.
Brewer, M., Joyce, R., Waters, T. and Woods, J., 2019. Universal credit and its impact on household incomes: the long and the short of it. Institute for Fiscal Studies (IFS), Report, https://ifs.org.uk/publications/universal-credit-and-its-impact-household-incomes-long-and-short-it.
Cribb, J. and Waters, T., 2019. Changes to pension credit rules for ‘mixed age couples’ mean a large number have to wait many years before they can claim. Institute for Fiscal Studies (IFS), Comment, https://ifs.org.uk/articles/changes-pension-credit-rules-mixed-age-couples-mean-large-number-have-wait-many-years-they.
Department for Work and Pensions, 2015. Welfare Reform and Work Bill: impact assessment to remove the ESA work-related activity component and the UC limited capability for work element for new claims. https://www.parliament.uk/globalassets/documents/impact-assessments/IA15-006B.pdf.
Department for Work and Pensions, 2019. Mixed age couples: benefit impacts of ending access to pension credit and pension age housing benefit. https://www.gov.uk/government/publications/mixed-age-couples-benefit-impacts-of-ending-access-to-pension-credit-and-pension-age-housing-benefit/mixed-age-couples-benefit-impacts-of-ending-access-to-pension-credit-and-pension-age-housing-benefit.
Department for Work and Pensions, 2022a. Benefit cap: number of households capped to February 2022. https://www.gov.uk/government/statistics/benefit-cap-number-of-households-capped-to-february-2022/benefit-cap-number-of-households-capped-to-february-2022.
Department for Work and Pensions, 2022b. Completing the move to universal credit. https://www.gov.uk/government/publications/completing-the-move-to-universal-credit/completing-the-move-to-universal-credit--2.
Department for Work and Pensions & HM Revenue and Customs, 2022. Universal credit and child tax credit claimants: statistics related to the policy to provide support for a maximum of 2 children, April 2022. https://www.gov.uk/government/statistics/universal-credit-and-child-tax-credit-claimants-statistics-related-to-the-policy-to-provide-support-for-a-maximum-of-2-children-april-2022/universal-credit-and-child-tax-credit-claimants-statistics-related-to-the-policy-to-provide-support-for-a-maximum-of-2-children-april-2022.
Emmerson, C., Joyce, R. and Waters, T., 2019. Stealthy changes mean that soon one in five families with children will be losing some child benefit. Institute for Fiscal Studies (IFS), Comment, https://ifs.org.uk/articles/stealthy-changes-mean-soon-one-five-families-children-will-be-losing-some-child-benefit.
HM Revenue and Customs, 2022. Income tax statistics and distributions. https://www.gov.uk/government/collections/income-tax-statistics-and-distributions.
HM Treasury, 2017. Spring Budget 2017. https://www.gov.uk/government/publications/spring-budget-2017-documents.
HM Treasury, 2021. Autumn Budget and Spending Review 2021: policy costings. https://assets.publishing.service.gov.uk/government/uploads/system/uploads/attachment_data/file/1029980/Policy_Costings_Document_FINAL.pdf.
Hood, A., 2017. A ‘double lock’ on the state pension would still be a bad idea. Institute for Fiscal Studies (IFS), Comment, https://ifs.org.uk/articles/double-lock-state-pension-would-still-be-bad-idea.
Joyce, R. and Waters, T., 2019. Benefit changes set to take effect during the next parliament. Institute for Fiscal Studies (IFS), Report, https://ifs.org.uk/publications/benefit-changes-set-take-effect-during-next-parliament.
Office for Budget Responsibility, 2018a. Economic and fiscal outlook – October 2018. https://obr.uk/efo/economic-fiscal-outlook-october-2018/.
Office for Budget Responsibility, 2018b. Welfare trends report – January 2018. https://obr.uk/wtr/welfare-trends-report-january-2018/.
Waters, T., 2017. TAXBEN: the IFS tax and benefit microsimulation model. Institute for Fiscal Studies (IFS), Resource, https://ifs.org.uk/publications/taxben-ifs-tax-and-benefit-microsimulation-model.
Waters, T. and Wernham, T., 2021. Budget measures bring number of families entitled to universal credit to 7 million’. Institute for Fiscal Studies (IFS), Comment, https://ifs.org.uk/articles/budget-measures-bring-number-families-entitled-universal-credit-7-million.
Data
Department for Work and Pensions, National Centre for Social Research, Office for National Statistics. Social and Vital Statistics Division. (2021). Family Resources Survey, 2019-2020. [data collection]. Retrieved from https://discover.ukdataservice.ac.uk/series/?sn=200017.
Endnotes
Authors

Tom Waters
Tom is an Associate Director at the IFS and Head of the Income, Work and Welfare sector.

Tom Wernham
Tom is a Research Economist in the Income, Work and Welfare sector, having joined the IFS in 2020.
More from IFS
Understand this issue


Policy analysis


Academic research


