
Downloads
Download a PDF of the report
PDF | 401.28 KB
Introduction
One year ago, NHS England published its plan to tackle the backlog of elective care, which had surged following the onset of the pandemic. Since then, as widely expected, waiting lists for NHS treatment in England have continued to grow, increasing by around 1 million between February and November 2022 to just shy of 7.2 million incomplete treatment pathways. In this report, we examine whether the NHS is on track to achieve the challenging ambitions laid out in its backlog recovery plan and present a number of different scenarios for waiting lists over the next two years.
The NHS has made meaningful progress in its efforts to reduce the number of patients waiting a very long time for treatment. But progress against its overall treatment volumes target has been far more limited. The ambition is to increase treatment volumes to 30% above pre-pandemic levels by 2024–25. As it stands, our judgement is that this is highly unlikely to be achieved – not least due to the lingering effects of COVID-19 and other pressures on the system. As a result, waiting lists are – in our view – unlikely to start falling rapidly any time soon. Instead, our central expectation is that waiting lists will more or less flatline over the next year, and fall only gradually from mid 2024. We present a number of scenarios to reflect the considerable uncertainty around this.
This is the final part in our three-part series on NHS performance. In the first part of the series, we examined how our previous set of scenarios compared with what subsequently happened to waiting lists. In the second part, we compared NHS funding, resources and treatment volumes with pre-pandemic levels, and explored the factors that could explain some of the ongoing challenges within the health service.
The backlog recovery plan
What was in the plan?
The backlog recovery plan, published in February 2022, included a number of ambitions (not formal targets) for elective care. The headline aim was to increase elective activity to around 30% more than pre-pandemic levels by 2024–25, with an increasing portion of this to be delivered outside of hospitals.
Alongside this, there were other specific ambitions around the numbers of people waiting a long time for treatment, which have been the main focus of the health service to date. These included a stated desire to eliminate waits over two years by July 2022, to eliminate waits over one-and-a-half years by April 2023, to eliminate waits over one-and-a-quarter years by March 2024, and to eliminate waits over one year by March 2025. Other ambitions focused on waiting times for diagnostic tests, cancer referrals and outpatient appointments, which we do not focus on in this piece.
Just a few weeks ago, the new Prime Minister reiterated the importance of NHS waiting lists for his government, making a reduction in waiting lists one of his five key priorities for 2023. Notably, unlike the objectives in the backlog recovery plan, this targets the size of the waiting list itself, rather than treatment volumes from the waiting list.
What has happened since the plan was released?
We first consider how NHS waiting list performance has compared with the ambitions of the plan, starting with the target to increase elective activity by 30% above pre-pandemic levels. Figure 1 shows the number of patients treated from the waiting list in 2022 and 2019.
Between January and November 2022, the NHS treated 6.6% fewer patients from the waiting list than it did over the same period in 2019. Both the number of admitted and the number of non-admitted (outpatient) treatments were substantially below their 2019 levels over the period. There has, however, been some progress over the course of the year. In November 2022, the number of patients treated from the waiting list rose substantially above 2019 levels for the first time. The NHS treated 1.55 million patients from the waiting list in November 2022, compared with 1.48 million in November 2019, an increase of 4.8%. This comes on the back of steady, if modest, increases in monthly treatment volumes since July.
The latest month of data are encouraging, but it remains the case that the NHS has struggled to make any meaningful progress against its headline target of increasing elective activity (which includes treatments from the waiting list) by 2024–25 to 30% above pre-pandemic levels. As we will discuss in the next section, some of the increase in elective activity will take place outside of hospitals, and so will not show up in these treatment volume statistics. And it is possible that increases in treatment volumes were always expected to be back-loaded, with more rapid increases in 2023 and 2024. But, nonetheless, the failure to increase elective treatment volumes to date means that an already challenging target has become even more so – since there is now less time to increase activity before 2024–25 – and has, in our judgement, become even less likely to be achieved.
We next consider the number of long waiters, the only ambition in the plan that had a 2022 deadline. Figure 2 shows how the number of people waiting more than one year for NHS treatment has changed between February 2022, the month the backlog recovery plan was published, and September 2022, the most recent month with complete data available (in October and November 2022, Frimley Health NHS Foundation Trust and Manchester University NHS Foundation Trust failed to report complete data, making a comparison of the distribution of waiting times impossible). Figure 3 shows the total number of people in each wait-length category between November 2019 and November 2022 (for which more complete data, with estimates for the missing trusts, are available).
The recovery plan included the ambition that the NHS would eliminate waits of more than two years for treatment by July 2022. Figures 2 and 3 show that this has largely been achieved – the number of people waiting for more than two years (the right-most bar in Figure 2 and the purple line in Figure 3) fell from 23,300 in February 2022 to 2,200 in September 2022, a reduction of 90.4%. By November 2022, the (estimated) number waiting more than two years had further fallen to 1,400, a 93.9% reduction compared with February 2022. While the number has not strictly reached zero, this should be viewed as a success for the NHS – it was never likely to completely eliminate these waits, as some of the treatment needed is very complex, and some patients may choose to wait longer.
However, the numbers in other target groups – for whom the deadlines are further into the future – have continued to grow. The ambition was to eliminate waits of between 1.5 and 2 years by April 2023, for instance. But the number of people waiting in this group grew from 45,200 to 48,500 between February 2022 and September 2022, an increase of 7.4%. Similarly, the number of people waiting between 1.25 and 1.5 years increased from 86,000 in February 2022 to 115,300 in September 2022, an increase of 34.0%.
In fact, the total number of people waiting more than a year for treatment has risen from 300,000 in February 2022 to 410,000 in November 2022, an increase of 35.8% (Figure 3). Prior to the pandemic, this number was effectively zero (1,845 in February 2020). It is true that the deadlines for eliminating these waits have not yet passed, and the NHS may yet successfully meet them. But the fact that the numbers in these groups have continued to grow illustrates the broader challenge: while waiting lists are continuing to grow overall, it is not mathematically possible for the NHS to reduce the number of people waiting for all time periods. Instead, it can only prioritise reducing some groups, such as those waiting more than two years, while other parts of the waiting list continue to grow.
Moreover, while it was a success to identify and reduce the number of people waiting more than two years, this was a relatively small group – at its peak, there were about 24,000 people waiting for more than two years. For comparison, in November 2022, there were 47,500 people waiting between 1.5 and 2 years for treatment and 357,600 waiting between 1 and 1.5 years. While these numbers might still appear modest relative to the size of the overall waiting list (more than 7 million) and to the aggregate number of treatments each month (around 1.5 million in November 2022), this is in part a reflection of how much the waiting list has grown. 400,000 people waiting for more than a year would have represented more than 17% of the total waiting list in January 2010 and 9% of the list in February 2020, versus less than 6% of the list now. In any case, the shift towards targeting patients waiting longer than a year still represents a step up from the challenge to date.
Taken together, one year on from the publication of the backlog recovery plan, NHS performance against the plan’s objectives has been mixed. The number of people waiting longer than two years has been dramatically cut, and the target of eliminating waits of more than 1.5 years by April 2023 remains within reach. At the same time, more concerningly, there has been little sign of a surge in elective treatment volumes, which puts at risk the headline ambition to increase elective activity levels by 30% above pre-pandemic levels, and makes the next round of long-waiter targets more difficult to achieve.
What next for waiting lists?
We now consider what could happen next to waiting lists, and update our previous scenarios for NHS waiting lists in England, to reflect the experience of the past year. To construct these scenarios, we must make assumptions about the number of people joining and leaving the waiting list each month. We first outline the range of assumptions we make, before showing what they imply for the potential future path of waiting lists.
Patients leaving the waiting list
The backlog recovery plan included the aim to increase elective activity by 30%, relative to pre-pandemic levels, by 2024–25. But the plan explicitly allowed for changes in how this additional activity was to be delivered: in other words, it would not necessarily mean 30% more hospital treatment pathways. In particular, the NHS planned for increased use of advice and guidance services. This initiative allows GPs to consult with specialist doctors (consultants) before or instead of a referral to hospital, with the goal of reducing the number of referrals that are made. Figure 4 shows the number of advice and guidance requests made each month between January 2019 and December 2022.
The number of advice and guidance requests has increased from 42,700 in January 2019 to 114,000 in December 2022, an increase of 167%. Using advice and guidance, NHS England projects that it will avoid an additional 1.1 million waiting list pathways in 2022–23, and 1.4 million in 2023–24 and 2024–25. Although there has been a large increase in advice and guidance requests, the NHS is still a fair way off achieving these projections. In the first nine months of 2022–23, there were 660,000 more requests than in the first nine months of 2019–20. Some of these requests will still result in a referral: they will not all translate into an avoided waiting list pathway (for which the target for the year is 1.1 million). Avoiding 1.4 million additional waiting list pathways in 2023–24 and 2024–25 implies that the overall number of requests will need to continue to grow rapidly in order to exceed that number by some margin.
According to the National Audit Office, although the backlog recovery plan referred to an increase in activity of ‘around 30%’, the operational target is for a 28.8% increase by 2024–25. After accounting for the (planned) increase in use of advice and guidance, this requires a 20.9% increase in elective activity levels, relative to 2019–20. Although substantially easier than having to increase volumes by 30%, this remains a challenging target.
Table 1 shows the three scenarios we consider for waiting list treatment volumes. We take as our starting point the average treatment volumes between September and November 2022, where NHS treatment volumes were just below 2019 levels (97%). In the first scenario, the NHS achieves its objective of increasing treatment volumes by 20.9% above pre-pandemic levels. But this requires achieving the equivalent of 10.3% annual growth in treatment volumes between now and March 2025 – an incredibly high growth rate. For comparison, between February 2015 and February 2020, treatment volumes grew by an average of 2.9% per year.
Table 1. Scenarios for waiting list treatment volumes
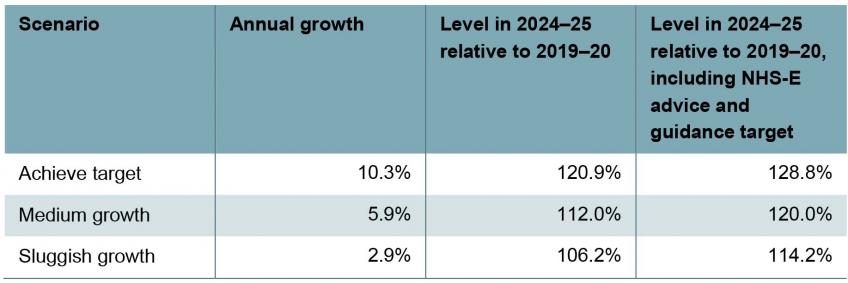
Note: Annual growth rates are calculated as the annualised growth rate from the average treatment volumes between September and November 2022 and the required treatment volume in March 2025. We assume that treatment volumes as a percentage of 2019 levels grow at a constant rate from the average of September to November 2022, to 26.0% above 2019 levels in March 2025 (the end of 2024–25) for ‘achieve target’ scenario, 14.6% above for ‘medium growth’ and 7.2% above 2019 levels for ‘sluggish growth’.
Source: Authors’ calculations using NHS England Referral to Treatment Waiting Times data and figure 2 of National Audit Office, ‘Managing NHS backlogs and waiting times in England’, November 2022, https://www.nao.org.uk/reports/managing-nhs-backlogs-and-waiting-times-in-england/.
Given this, we consider two additional scenarios for treatment volumes. In our ‘sluggish growth’ scenario, we assume that the NHS increases treatment volumes by 2.9% per year (the average growth rate observed over the five years pre-pandemic) between now and March 2025, which would take treatment volumes in 2024–25 to 6.2% above 2019–20 levels. In our ‘medium growth’ scenario, we assume that the NHS increases treatment volumes by 5.9% per year (double the pre-pandemic rate, sufficient to return to the pre-pandemic trend – see below), implying 2024–25 treatment volumes 12.0% higher than in 2019–20. After allowing for the (planned) increase in advice and guidance, these would take overall activity levels in 2024–25 to 14.2% and 20.0% above 2019–20 levels, respectively. These increases would fall short of the ambition in the recovery plan, but would – as we show below – still be substantive by historical standards, and would still be challenging to deliver amidst an array of wider pressures on the service.
For context, Figure 5 shows how treatment volumes have changed since 2007, as well as the pathway of treatment volumes implied by each of these three scenarios. The black dotted line shows the pre-pandemic trend (i.e. the trend had the pre-pandemic growth rate of 2.9% per year continued from the start of 2020). This is an estimate of what might have happened had the pandemic not occurred. The yellow line shows that in order to deliver on the ambitions of the backlog recovery plan, activity would need to grow at a much faster sustained rate than has been achieved at any point since 2007 (when comparable records began), to a monthly total of more than 1.7 million completed pathways by late 2024. This means that by the end of 2024–25 the NHS would treat 200,000 more patients per month than if treatment volumes had continued to grow in line with the pre-pandemic trend. The NHS would need to go above this pre-COVID trend in order to ‘catch up’ on any care missed during the pandemic. The blue line, which shows our medium growth scenario, is much closer to this counterfactual level of treatment volume.
Receiving treatment is not the only reason people leave the waiting list. People also leave because they have died, no longer need treatment or have received private treatment. We assume that each month 3% of people on the waiting list leave for these other reasons. This is approximately the level that this ‘other outflow’ has been since 2021. This is lower than the rate pre-pandemic, but because of the much greater size of the waiting list, this means a roughly similar number of individuals leaving the waiting list each month as pre-pandemic.
Patients joining the waiting list
To allow for uncertainty over the level of demand, we also make a range of assumptions about the number of patients joining the waiting list. As well as reducing the amount of elective treatment the NHS needs to deliver, advice and guidance requests are intended to reduce the number of people joining the waiting list. In our past analysis of possible paths for waiting lists, we assumed that there would be a surge in demand as some of the 8 million or so patients who missed joining waiting lists during the pandemic returned to seek care. However, there has been no such surge. In light of this, we assume here that there will be fewer new patients joining the waiting list than we did in the past. Forecasting demand for elective treatment is difficult in part because demand itself depends on the size of waiting lists. With higher waiting lists, patients may be less likely to bother to seek NHS treatment, and GPs may be less likely to refer patients onto waiting lists.
Table 2 shows the three scenarios we consider for the number of people joining the waiting list. We take as our starting point the average between September and November 2022, where the number of new patients joining the waiting list was 97% of 2019 levels. In our ‘catch-up demand’ scenario, we assume that the number of people joining the waiting list will grow to be 8% higher in March 2025 than in March 2019; in our ‘medium demand’ scenario, we assume that it will be 4% higher; and in our ‘stable demand’ scenario, we assume that it will be no higher than in March 2019. Across 2024–25, this would equate to an 8.5% increase in the number of new patients relative to 2019–20 (‘catch-up demand’), a 5.3% increase (‘medium demand’) and a 2.0% increase (‘stable demand’), equivalent to annual growth of 5.4%, 3.7% and 2.0%, respectively.
Table 2.Scenarios for number of new patients joining the waiting list each month
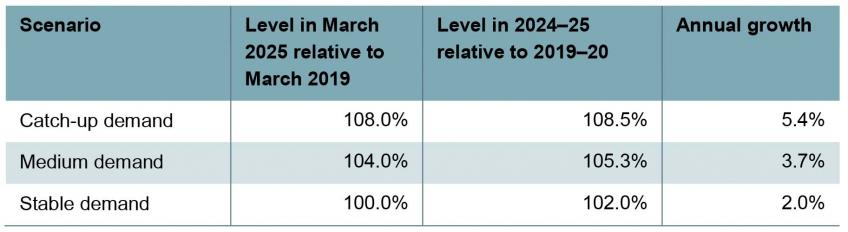
Note: Annual growth rates are calculated as the annualised growth rate from the average number of new patients joining the waiting list between September and November 2022 and the required number of new patients joining the waiting list in March 2025.
Source: Authors’ calculations using NHS England Referral to Treatment Waiting Times data.
Waiting list scenarios
Figure 6 shows four scenarios for waiting lists, based on different combinations of assumptions. The green line shows what has actually happened to waiting lists between December 2019 and November 2022. The other lines then project forward what could happen to waiting lists between December 2022 and March 2025 under different scenarios.
The yellow line sets out our central scenario. In this scenario, we assume that the NHS does not achieve the target in its backlog recovery plan, but instead follows our medium growth scenario, treating 12.0% more patients from the waiting list in 2024–25 than in 2019–20. We think that it is unlikely the NHS will achieve its full target, given that this would require double-digit annual growth in treatment volumes, but that it will still succeed in dramatically increasing treatment volumes above what it is managing now and what it was managing pre-pandemic. We assume that the number of patients joining the waiting list grows according to our medium demand scenario, reaching 4% above 2019 levels by March 2025. Under these assumptions, waiting lists would more or less flatline during 2023, before starting to fall more steadily from mid 2024. The Prime Minister’s commitment to reduce waiting lists would be narrowly missed this year.
The blue line sets out a scenario where the NHS hits its treatment target, but there is catch-up demand. This means that treatment volumes reach the elective recovery target of 20.9% above pre-pandemic levels, but the number of patients joining the waiting list reaches 8% above 2019 levels by March 2025. In this scenario, waiting lists fall from the middle of 2023, and fall faster than in our central scenario, reaching 6.3 million by the end of 2024–25.
The red line sets out a scenario where the NHS again hits its treatment target, but demand is stable – whether due to tighter rationing by the NHS or by patients themselves. In this case, we assume that the number of patients joining the waiting list in March 2025 is no higher than in 2019. Waiting lists fall much faster under this scenario, reaching 4.8 million by the end of 2024–25. This shows the importance of the number of patients joining the list for determining the trajectory – in the blue and red scenarios, the NHS treats the same number of patients, but the outcomes differ because the number of patients joining the waiting list is different.
Finally, the purple line sets out a scenario where the NHS manages only sluggish growth in treatment volumes and faces medium growth in demand. In this case, we assume that the NHS can only increase its treatment volumes to 6.2% above its pre-pandemic levels, and that the number of patients joining the waiting list grows to 4% above its 2019 level by the end of 2024–25. In this pessimistic scenario, waiting lists continue to rise over the whole period, though at a slightly slower rate than they have grown over the last two years.
Table 3 shows what could happen to waiting lists under each combination of our three assumptions around treatment volumes and number of patients joining the waiting list. The coloured sections line up with the scenario in Figure 6 with the same colour. There is less uncertainty about the level at which waiting lists will peak: provided that the NHS increases treatment volumes sufficiently, our analysis suggests a likely peak of between 7.5 and 8 million. That peak could occur in mid 2023 or mid 2024, depending primarily on how quickly treatment volumes can be increased. Notably, this would be nothing close to the 13 million peak which then Health Secretary Sajid Javid warned of as a possibility in July 2021. This reflects just how few of the ‘missing’ pandemic patients have subsequently joined the waiting list for care.
Table 3. Range of scenarios for waiting lists
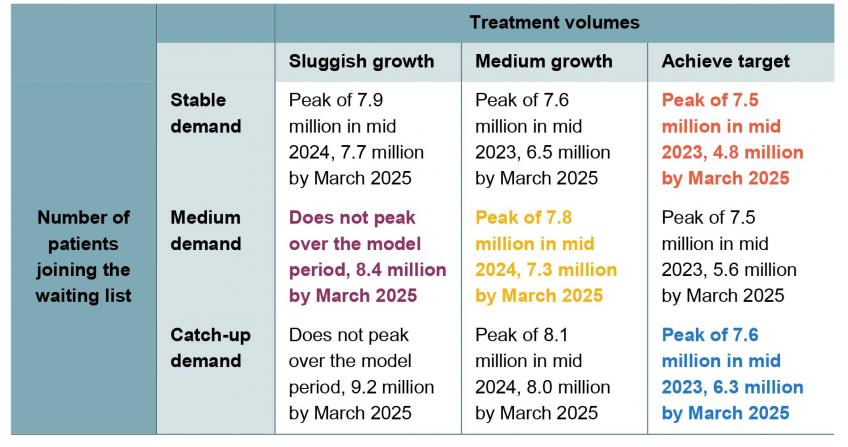
Note & source: See Figure 6.
There is much more uncertainty around the level of waiting lists come 2025. In our central scenario, the overall size of the waiting list in March 2025 would be more or less identical to what it is now. In the best-case scenario that we consider (for waiting lists, we should stress – not necessarily for population health), the waiting list could be as low as 4.8 million by March 2025 (though this would still be above pre-pandemic levels); in the worst case that we consider, it could be more than 9 million.
Conclusion
One year on from the publication of the backlog recovery plan, NHS performance against the plan’s ambitions has been mixed. The only hard deadline that has passed – for waits of more than two years to be eliminated by July 2022 – has been (more or less) achieved. But progress against more distant ambitions has been limited. The NHS has until April 2023 to eliminate waits longer than one-and-a-half years. Although the number waiting this long has increased by 7.4% (to 48,500) since the plan was published, this remains very much achievable in the remaining time available.
The more fundamental challenge is that the NHS has so far struggled to increase the number of people it is treating from the waiting list each month. As a result, the overall size of the waiting list has continued to grow – as has the number of people waiting for more than a year for treatment.
The headline ambition of the recovery plan was to increase levels of elective activity to substantially above pre-pandemic levels. If the NHS can deliver on this ambition, and increase treatment volumes by 20.9% by 2024–25 (or around 30% after accounting for planned increases in advice and guidance), then waiting lists will likely start to fall from the middle of this year. But this would require double-digit growth in treatment volumes over the next two years. This would be difficult to achieve even in a normal year, but the continued pressures faced elsewhere by the NHS mean that, in our judgement, this is highly unlikely to be achieved.
Instead, our central judgement is that the NHS will be able to increase treatment volumes significantly, but by less than planned. In this case, we would expect waiting lists to more or less flatline for the next year, and start falling slowly but steadily from the middle of next year.
There is nothing remotely certain about this. But our assessment is that for waiting lists to start falling meaningfully this year – as the Prime Minister has all but promised – it would require one of two things to happen. One, the NHS achieves a truly remarkable increase in how many patients it manages to treat. Or two, the number of people joining the waiting list for treatment stays unexpectedly low – whether because they do not think they need NHS care or because they are unable to access it.
Authors

Max Warner
Max joined the IFS in 2020 as a research economist in the Healthcare Sector, with a focus on the NHS labour force and adult social care in England.

Ben Zaranko
Ben is a Senior Research Economist and an editor of the IFS Green Budget. His work focuses on the health and social care system and UK fiscal policy.
More from IFS
Understand this issue


Policy analysis


Academic research


