Downloads
Support-for-the-self-employed-during-Covid-19-BN274-.pdf
PDF | 199.6 KB
Later today (26 March 2020) the Chancellor is due to announce measures to help the self-employed. So far, the self-employed have seen some increase in the social safety net via increases in the generosity of universal credit (UC) but no equivalent to the new Job Retention Scheme (JRS) that supports employees. This note sets out the context for today’s announcement.
- Policies announced so far have had an enormous effect on employees’ ‘replacement rates’: assuming they can make use of the Job Retention Scheme 86% of employees now have at least 80% of their net family income replaced when out of work, compared to just 10% before. Sharp increases in replacement rates have been seen right across the income distribution.
- There has been hardly any change in replacement rates for the self-employed.[1] Some self-employed workers, mostly with working partners or substantial financial assets, will see no change in their replacement rates as a result of changes to policy over the last two weeks.
- Nearly a million (22%) of the self-employed work in sectors that are seeing large falls in demand and will be mostly shut as a result of social distancing measures, compared to 17% of employees.
- A further 0.4 million (9%) of self-employed workers have a young child (aged under ten) and no key workers or non-working adults in the family, such that they may have to disrupt their work to provide childcare.
- 0.8 million self-employed workers in the construction sector may lose work if they haven’t already and restrictions are tightened further.
- 23% of self-employed workers were in relative poverty in 2017–18, after deducting housing costs, compared to just 11% of employees. Many low-income self-employed workers will see their incomes bolstered by the changes to UC, but they still have far more to lose from temporarily having to stop work than employees with similar levels of income.
The policy response so far
The basic elements in Universal Credit (UC) and working tax credit have been increased by £1,000 per year. Maximum entitlements to housing benefit (and the housing element of UC) for private renters have been increased to the 30th percentile of private rents in the local area, primarily benefiting those who live in areas where rents have grown a lot since 2012 (such as Cambridge and some areas around London). And the minimum income floor in UC – under which self-employed workers were treated as if they had earnings equal to the full-time minimum wage if they in fact earned less – has been suspended.
Through the Coronavirus Job Retention Scheme (JRS) the government will compensate employers for 80% of wages for furloughed employees, up to £2,500 a month.
Figure 1 shows how these reforms have affected ‘replacement rates’ – a family’s out-of-work net income as a share of their in-work net income when an individual loses their job – for employees and the self-employed. Replacement rates are affected by the tax and benefit system (as taxes are generally lower and benefits higher when an individual is out of work), and any other sources of income that are not lost when an individual loses their job, including a partner’s earnings.
Figure 1. Replacement rates, for employees and the self-employed, before and after recent reforms
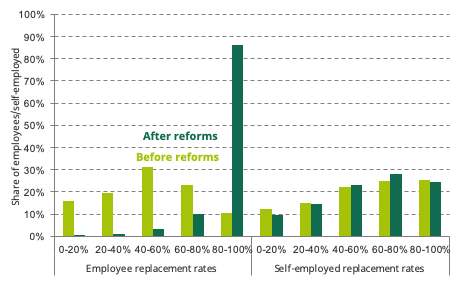
Notes: Replacement rates are defined as out-of-work income divided by in-work income. Incomes are measured after taxes and benefits and aggregated to the family level, and replacement ra tes are calculated for individuals (i.e., they show what would happen to family incomes if one individual fell out of work). We calculate replacement rates only for those observed in-work. The reforms analysed are the JRS, the increase to UC, the increase to LHA, and the suspension of the MIF. Calculations are on the assumption of full rollout of UC and complete take-up of benefits, including the JRS.
Sources: Authors’ calculations using the Family Resources Survey 2017–18 and TAXBEN, the IFS tax and benefit microsimulation model.
Replacement rates have been increased a lot for employees but not the self-employed
As the figure makes clear, these reforms have had an enormous effect on replacement rates for employees, with 86% having a replacement rate of at least 80% after the reforms, compared to just 10% before. That is, only 14% face losing more than a fifth of their family income now, compared with 90% before the reforms. Changes this large are not entirely surprising given the JRS, which ensures that gross earnings do not fall by more than 20% for employees earning under £37,500 p.a. (and net income, after accounting for tax and any other forms of income, will fall by even less). However, the self-employed have seen far less change. While the welfare policies slightly increase replacement rates on average, the changes provide relatively little compensation compared to those for employees: about three-quarters of them still face losing more than a fifth of their family income if they have to stop work. This is especially true for self-employed workers with working partners or significant financial assets, who may not be eligible for UC even when out of work and thus see no change in their replacement rates as a result of the policy.
Figure 2 shows average replacement rates across the income distribution, again split by employees and the self-employed and before and after reforms. High and low income employees alike have seen a sharp increase in replacement rates, with average replacement rates in all but the top decile above 85%. But there has been little change in replacement rates for self-employed families at any part of the income distribution. At the higher end, the increases in benefits provide little insurance, since these make up only a small fraction of these families’ in-work incomes and other income sources may mean they are ineligible for UC when out of work anyway. But at the lower end of the income distribution, the suspension of the minimum income floor serves to reduce replacement rates, since it increases the UC they can get if earning a little but makes no difference to the amount they get if they are unable to work at all.
Figure 2. Average replacement rates by income decile, for employees and the self-employed, before and after recent reforms
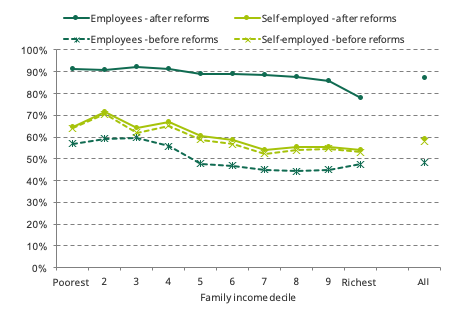
Notes and Sources: See Figure 1. Income deciles are defined on family incomes, using the modified OECD equivalence scale.
The JRS – the principle reform which has increased replacement rates for employees – affords no insurance to employees who see their earnings fall but not all the way to zero, because only workers who are not working at all can benefit. In contrast, the suspension of the minimum income floor insures low income self-employed workers against declines in their incomes, since – without a minimum income floor – those declines will be partly offset by increases in UC. This is valuable insurance against hours or earnings falling to a level above zero.
The self-employed work in sectors seeing large falls in demand
That the self-employed are far less protected from temporary job loss is particularly worrying in light of the jobs they do. Figure 3 shows the share of self-employed workers in sectors that are directly affected by social distancing measures. It shows that 22% of the self-employed work in sectors that are badly hit, compared to 17% of employees (note that the total number of employees affected is still much larger). This is because the self-employed are much more likely to work in personal services (e.g. cleaning and hairdressing), arts and leisure (e.g. performing arts or fitness instruction) and passenger transport (e.g. taxi services).
In total, nearly a million (0.9 million) self-employed people work in sectors that will be mostly shut down during the crisis period. If restrictions are tightened further, the 0.8 million self-employed workers in the construction sector may also be affected (if they haven’t been already). And on top of the 0.9 million workers in badly hit sectors, a further 0.4 million self-employed workers have a young child (aged 0-9) and no key workers or non-working adults in the family, such that they may have to disrupt their work to provide childcare.
Figure 3. Share of workers in industries most affected by social distancing measures
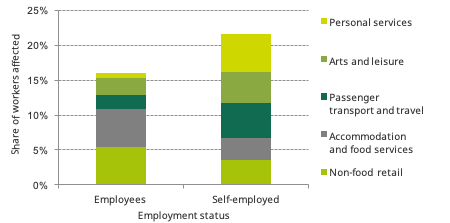
Source: Labour Force Survey Q1-Q4 2019, Waves 1 and 5
Although some self-employed workers have very high earnings, the self-employed tend to have lower earnings than employees. Average (median) post-tax earnings were £1,500 per month for employees and just £1,160 per month for the self-employed in 2017–18, the latest year for which data on self-employment earnings are available. 23% of self-employed workers lived in relative poverty in 2017–18, after deducting housing costs, compared to just 11% of employees. Many low-income self-employed workers will see their incomes bolstered by the changes to UC, but as Figure 1 shows, they still have far more to lose from being temporarily having to stop work than employees with the same levels of income.
Notes
[1] We define the self-employed as those running unincorporated businesses. This excludes business owners who are directors of limited liability companies, who may have their salaries (but not dividends) covered by the JRS.
Authors

Stuart Adam
Stuart is a Senior Economist working in the Tax sector, and focuses on analysing the design of the tax and benefit system.

Helen Miller
Helen is Deputy Director of the IFS and Head of the Tax sector.

Tom Waters
Tom is an Associate Director at the IFS and Head of the Income, Work and Welfare sector.

Xiaowei Xu
Xiaowei joined the IFS in 2018 and works in the Income, Work and Welfare sector.
More from IFS
Understand this issue


Policy analysis


Academic research


